Following on from November’s “Turkey Rally”, December defied weaker recent seasonality trends and delivered a present for investors in the form of outsized stock market returns. Now as we move into January and the new year, investors are asking where does seasonality point to now for stocks, and have returns been “pulled forward” following a strong festive period?
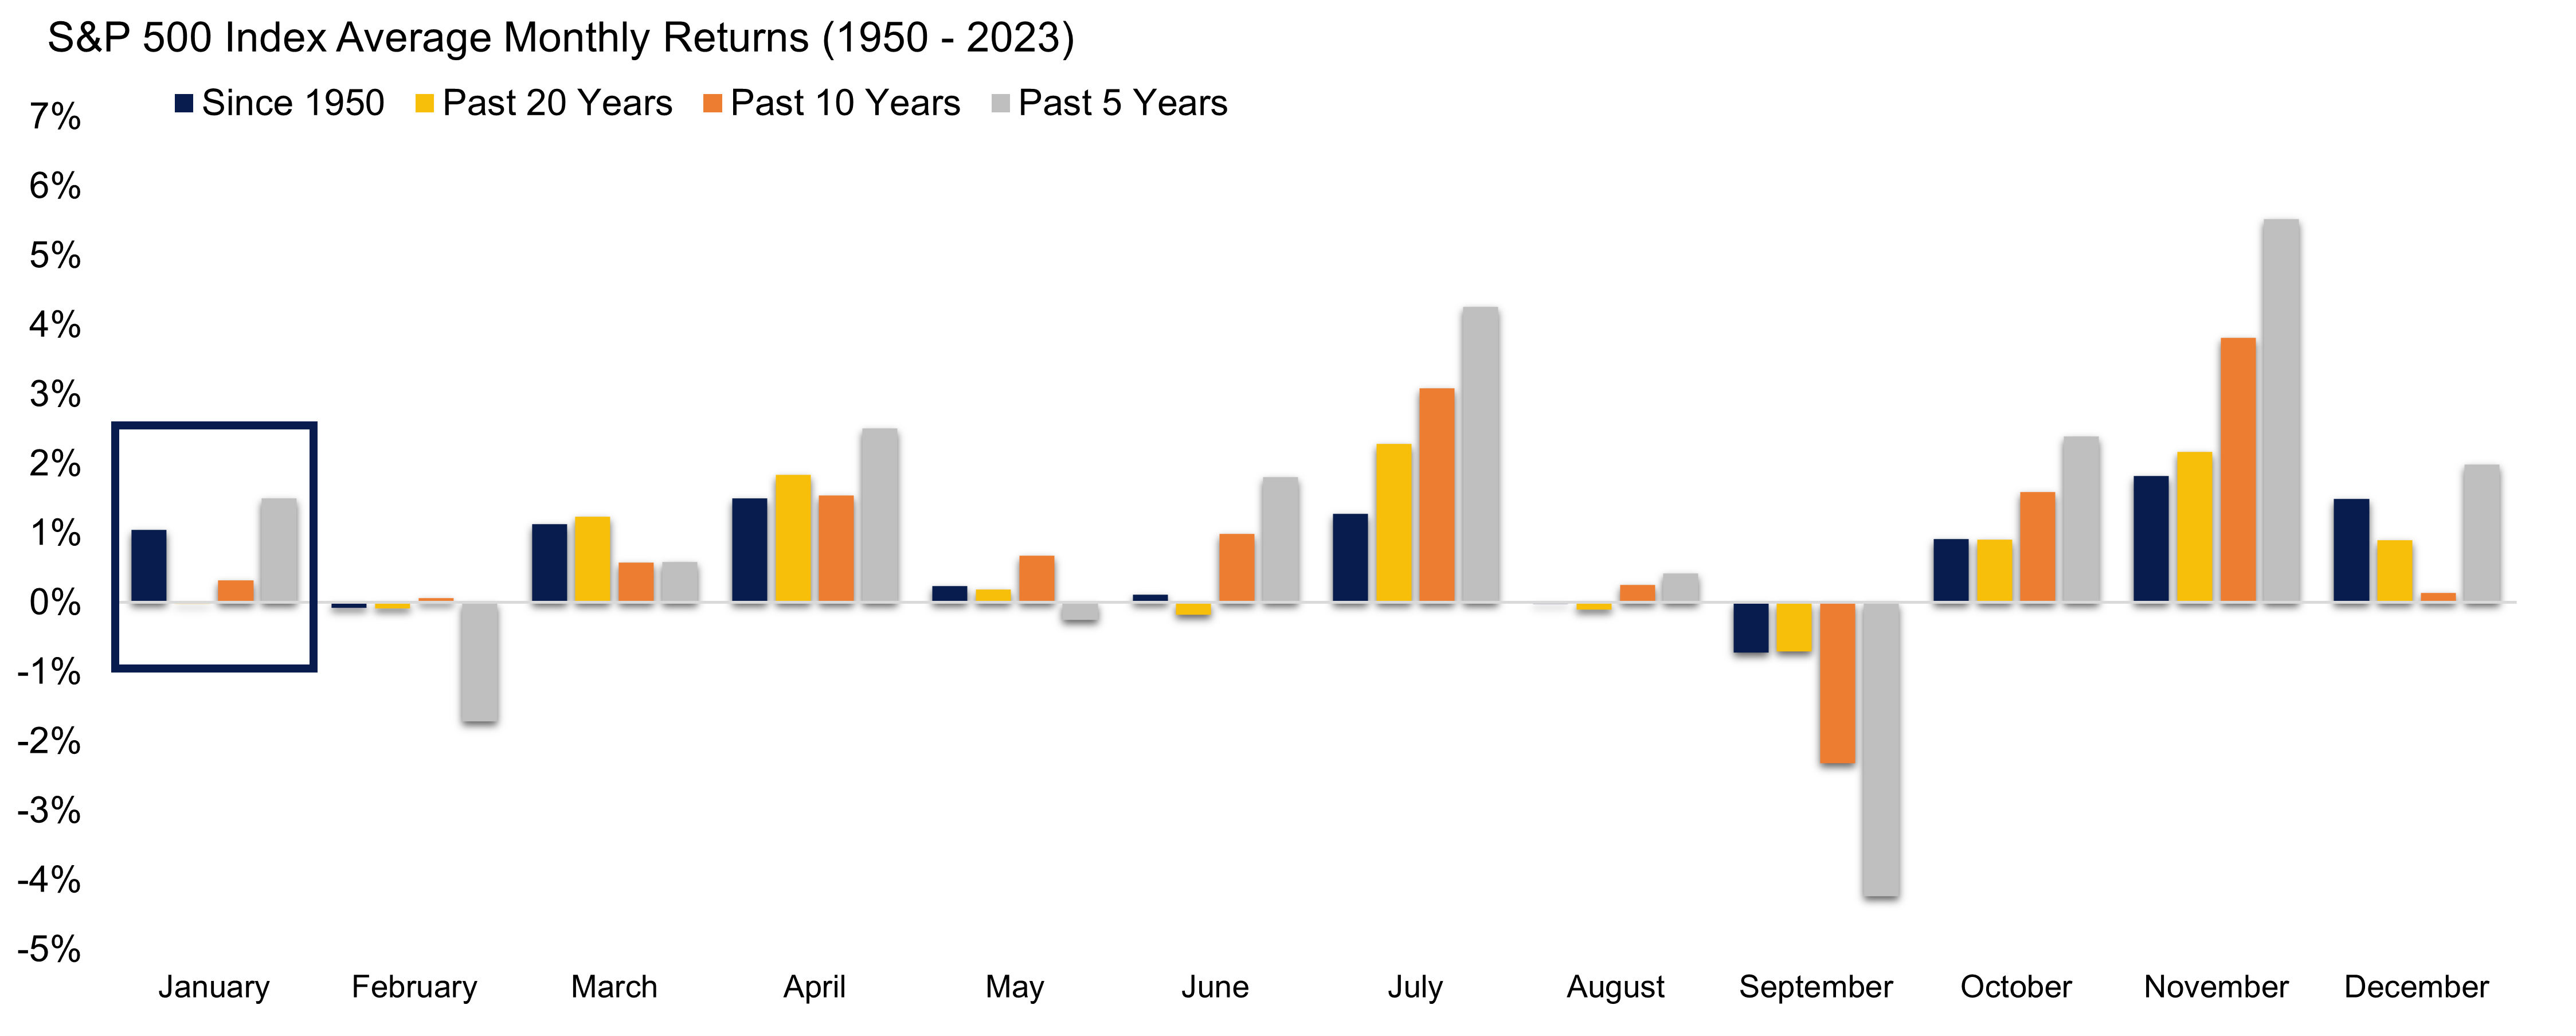
December continued the strong momentum that brought almost a 9% stock market gain in November (using the S&P 500 for reference), delivering a present for stock market investors in the form of an almost 5% gain (as of close on December 28). Assuming no collapse today, this will rank as the best December for stocks since 2010 and the 12th best December since 1950. Including the strong December we just experienced, the month is firmly back on the “nice” list with an average return over the past five years of 2% (up from a weaker 0.3% average as it stood coming into the month). The November and December two-month return of over 14% is the 12th-best two-month return since 1950 and the best since the same two months in 2020.
Looking forward to January seasonals, it has historically been a positive but middle-of-the-road month, ranking 7th of all months over the last five years. The returns over the past 10 and 20 years, however, are almost flat, ranking 8th out of all months over those periods.
December Back on the Nice List, January Seasonals Also Behaving
S&P 500 Index Average Monthly Returns (1950–2023)

Source: LPL Research, FactSet, Bloomberg 12/28/23 (1950–current)
Disclosures: All indexes are unmanaged and cannot be invested into directly. Past performance is no guarantee of future results.
The modern design of the S&P 500 Index was first launched in 1957. Performance before then incorporates the performance of its predecessor index, the S&P 90.
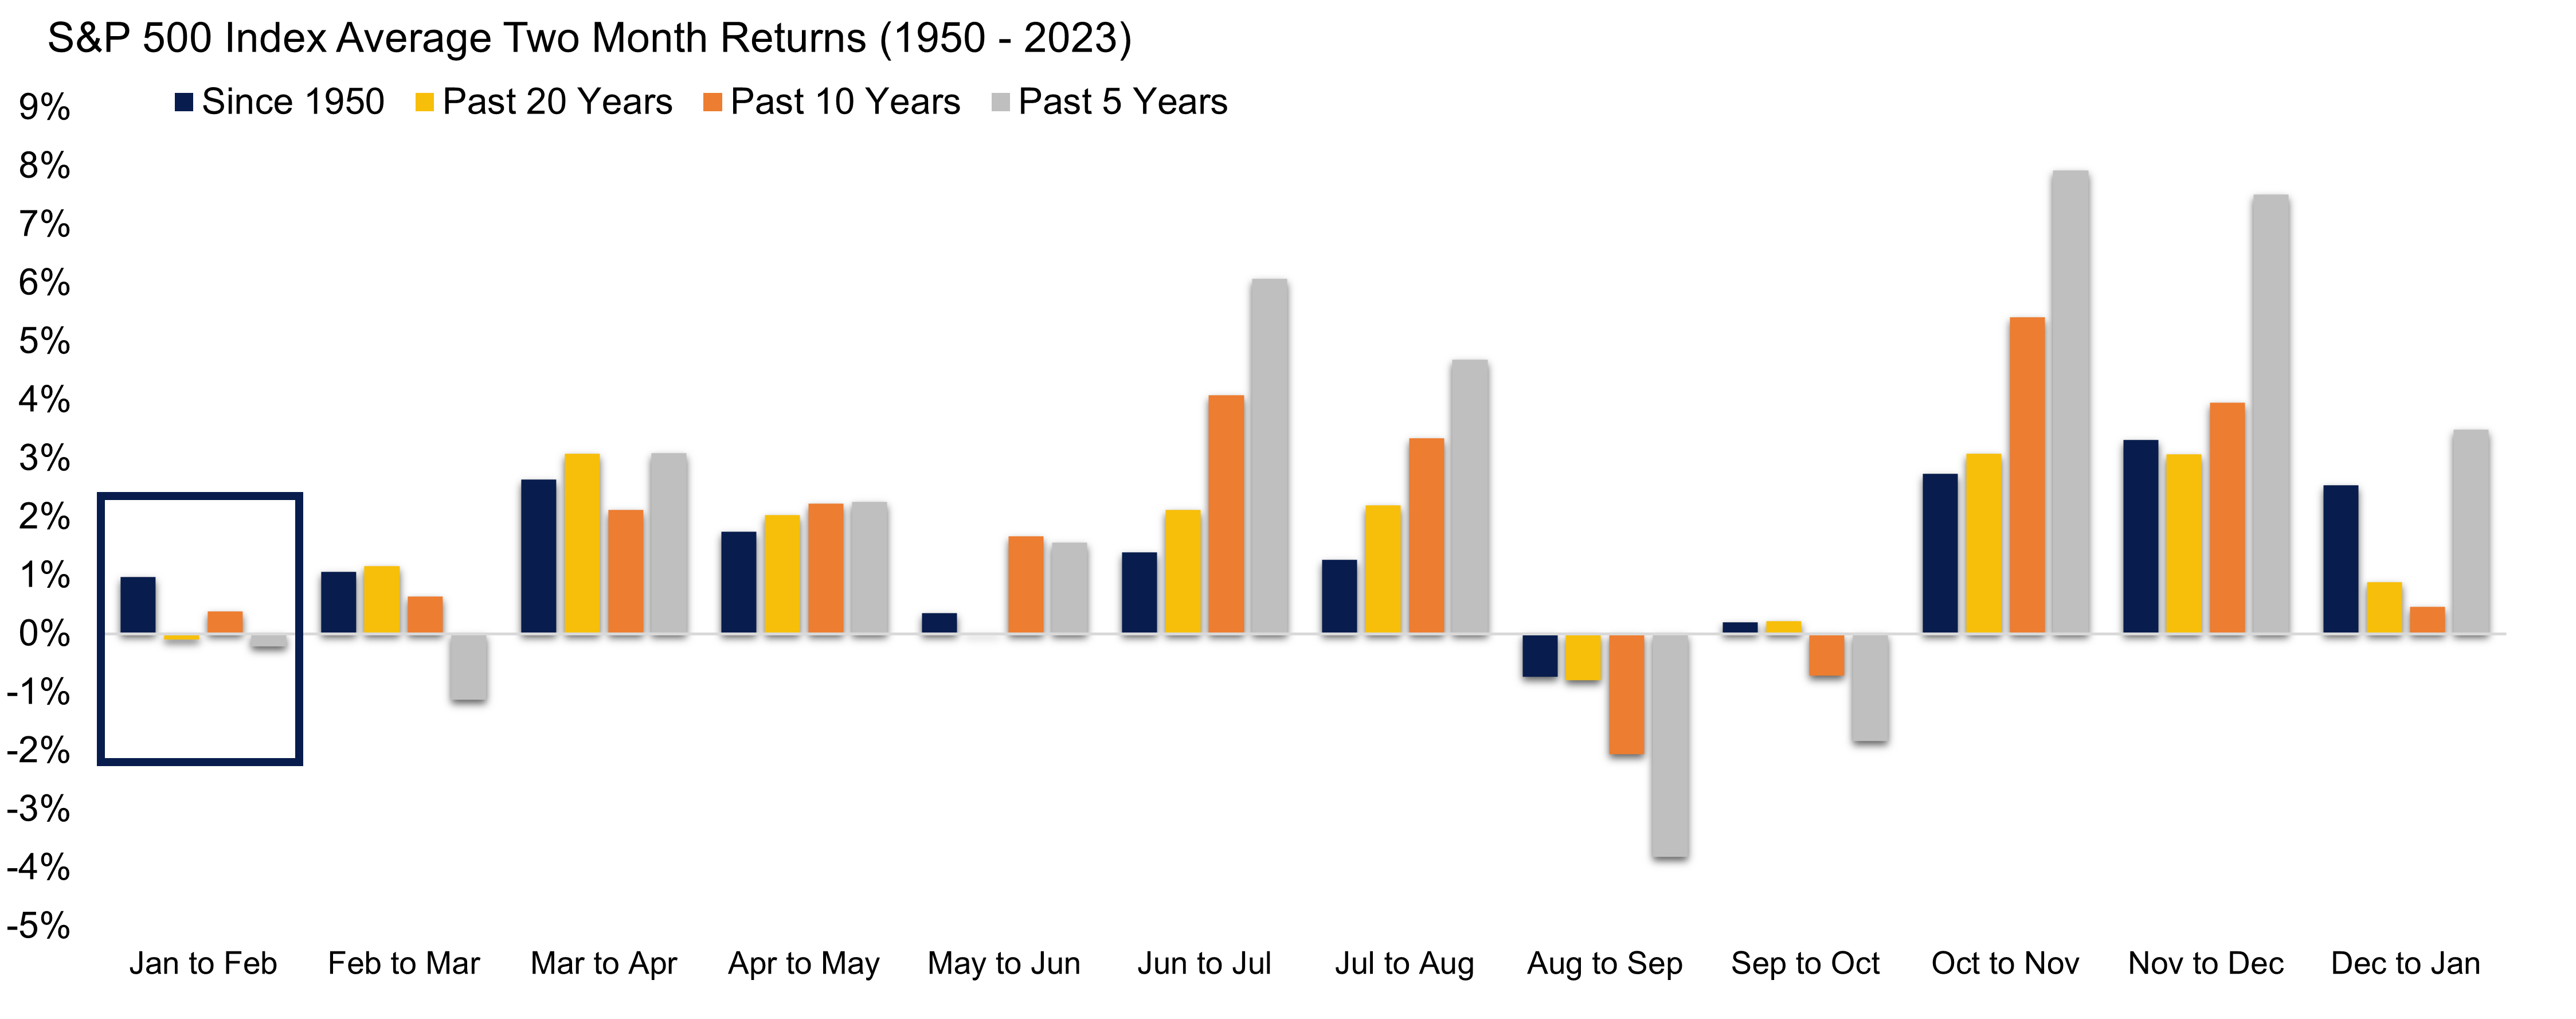
When looking at slightly longer seasonals, the January–February period tends to have weaker performance compared to other two-month return windows, ranking between 9th and 11th of all such two-month windows over the periods studied. Much of this is due to a weak February dragging down the two-month return, with February being the second-worst month (behind September) for stocks over the past 5- and 10-year periods as well as all years back to 1950.
Seasonals Turn Weaker with January–February Two-Month Period
S&P 500 Index Average Two-Month Returns (1950–2023)

Source: LPL Research, FactSet, Bloomberg 12/28/23 (1950–current)
Disclosures: All indexes are unmanaged and cannot be invested into directly. Past performance is no guarantee of future results.
The modern design of the S&P 500 Index was first launched in 1957. Performance before then incorporates the performance of its predecessor index, the S&P 90.
So, have positive stock market returns been “pulled forward” after the very strong months we just had? When stocks gain more than 10% during the November–December period, January has historically been quite strong, with gains of 2.3% on average during the six times this has occurred. This is well above the average return for all Januaries since 1950 of around 1%. Looking at January’s that followed just a strong December (over 4% gain), however, gains average just 1%, with 11 of 15 occurrences ending in the green to start the new year.
As we examined last month, following November’s outsized stock returns, stock market strength begets strength when it comes to the next 12 months following the strong monthly returns. The same study, but with two-month periods when stocks have risen more than 14%, looks equally promising for investors. Looking at all periods back to 1950, there have been just 12 occasions where the S&P 500 has gained over 14% in a two-month period. The average return a year afterwards is over 20%, well outpacing the return of around 9% for all periods that followed two-month periods where stocks returned less than 14%. Returns a year out from strong two-month returns have also been overwhelmingly positive, with the only negative yearly returns occurring in 1987–88, as a very strong January and February preceded the “Black Monday” stock market crash in autumn 1987.
In summary, after an incredible November–December period for stock markets, overall stock market seasonals may turn weaker in the new year, but stocks have historically performed well over the full year following such outstanding periods of strength. Stabilizing inflation, the likely end of the rate hiking cycle, lower long-term interest rates, and lower energy prices continue to be positives for stocks, but increasingly stretched valuations and market positioning may become headwinds to significant near-term progress for stocks.
If you'd like to discuss these topics, or others, please feel free to reach out or book a meeting with us.
Sincerely,
Bryan Foronjy, CFP®
Founder and Principal Wealth Manager
Foronjy Financial
CA Insurance Lic. # 0F84170
Schedule an office (or phone) appointment here:
https://go.oncehub.com/MeetWithBryanForonjy
San Luis Obispo Office Contact Information:
(805) 543-1033
956 Walnut St, #200
San Luis Obispo, CA 93401
Santa Barbara Office Contact Information:
(805) 880-9444
401 Chapala St, #105
Santa Barbara, CA 93101
Bryan Foronjy is a registered representative with, and securities offered through LPL Financial, Member FINRA/SIPC. Investment advice offered through Mariner Independent Advisor Network LLC, a registered investment advisor. Mariner Independent Advisor Network LLC and Foronjy Financial are separate entities from LPL Financial.
The information contained in this email message is being transmitted to and is intended for the use of only the individual(s) to whom it is addressed. If the reader of this message is not the intended recipient, you are hereby advised that any dissemination, distribution or copying of this message is strictly prohibited. If you have received this message in error, please immediately delete.
IMPORTANT DISCLOSURE
This material is for general information only and is not intended to provide specific advice or recommendations for any individual. There is no assurance that the views or strategies discussed are suitable for all investors. To determine which investment(s) may be appropriate for you, please consult your financial professional prior to investing.
Investing involves risks including possible loss of principal. No investment strategy or risk management technique can guarantee return or eliminate risk.
Indexes are unmanaged and cannot be invested into directly. Index performance is not indicative of the performance of any investment and does not reflect fees, expenses, or sales charges. All performance referenced is historical and is no guarantee of future results.
This material was prepared by LPL Financial, LLC. All information is believed to be from reliable sources; however LPL Financial makes no representation as to its completeness or accuracy.
Unless otherwise stated LPL Financial and the third party persons and firms mentioned are not affiliates of each other and make no representation with respect to each other. Any company names noted herein are for educational purposes only and not an indication of trading intent or a solicitation of their products or services.
Asset Class Disclosures –
International investing involves special risks such as currency fluctuation and political instability and may not be suitable for all investors. These risks are often heightened for investments in emerging markets.
Bonds are subject to market and interest rate risk if sold prior to maturity.
Municipal bonds are subject and market and interest rate risk and potentially capital gains tax if sold prior to maturity. Interest income may be subject to the alternative minimum tax. Municipal bonds are federally tax-free but other state and local taxes may apply.
Preferred stock dividends are paid at the discretion of the issuing company. Preferred stocks are subject to interest rate and credit risk. They may be subject to a call features.
Alternative investments may not be suitable for all investors and involve special risks such as leveraging the investment, potential adverse market forces, regulatory changes and potentially illiquidity. The strategies employed in the management of alternative investments may accelerate the velocity of potential losses.
Mortgage backed securities are subject to credit, default, prepayment, extension, market and interest rate risk.
High yield/junk bonds (grade BB or below) are below investment grade securities, and are subject to higher interest rate, credit, and liquidity risks than those graded BBB and above. They generally should be part of a diversified portfolio for sophisticated investors.
Precious metal investing involves greater fluctuation and potential for losses.
The fast price swings of commodities will result in significant volatility in an investor's holdings.
Securities and advisory services offered through LPL Financial, a registered investment advisor and broker-dealer. Member FINRA/SIPC.
Not Insured by FDIC/NCUA or Any Other Government Agency | Not Bank/Credit Union Deposits or Obligations | Not Bank/Credit Union Guaranteed | May Lose Value
For Public Use – Tracking: #522015


